Projects
VizLab: The Virtual Reality-enabled Scientific Workspace of the Future
PIs: Ana Bonaca and Anthony Piro (Observatories, Carnegie Science)
SASE: Chris Couto, Scholar
The Schmidt Academy worked with Carnegie Observatories to develop custom software for their VizLab - a 35-screen tiled wall display with 3D rendering and tracked VR-like inputs. The system was built in 2020 with a vision to become a hub for collaborative data analysis. Carnegie Observatories houses a large community of astrophysicists, with work ranging from observations and simulations to in-house instrument design and manufacturing. Meeting the community’s many needs for research and outreach purposes has been central to this project.
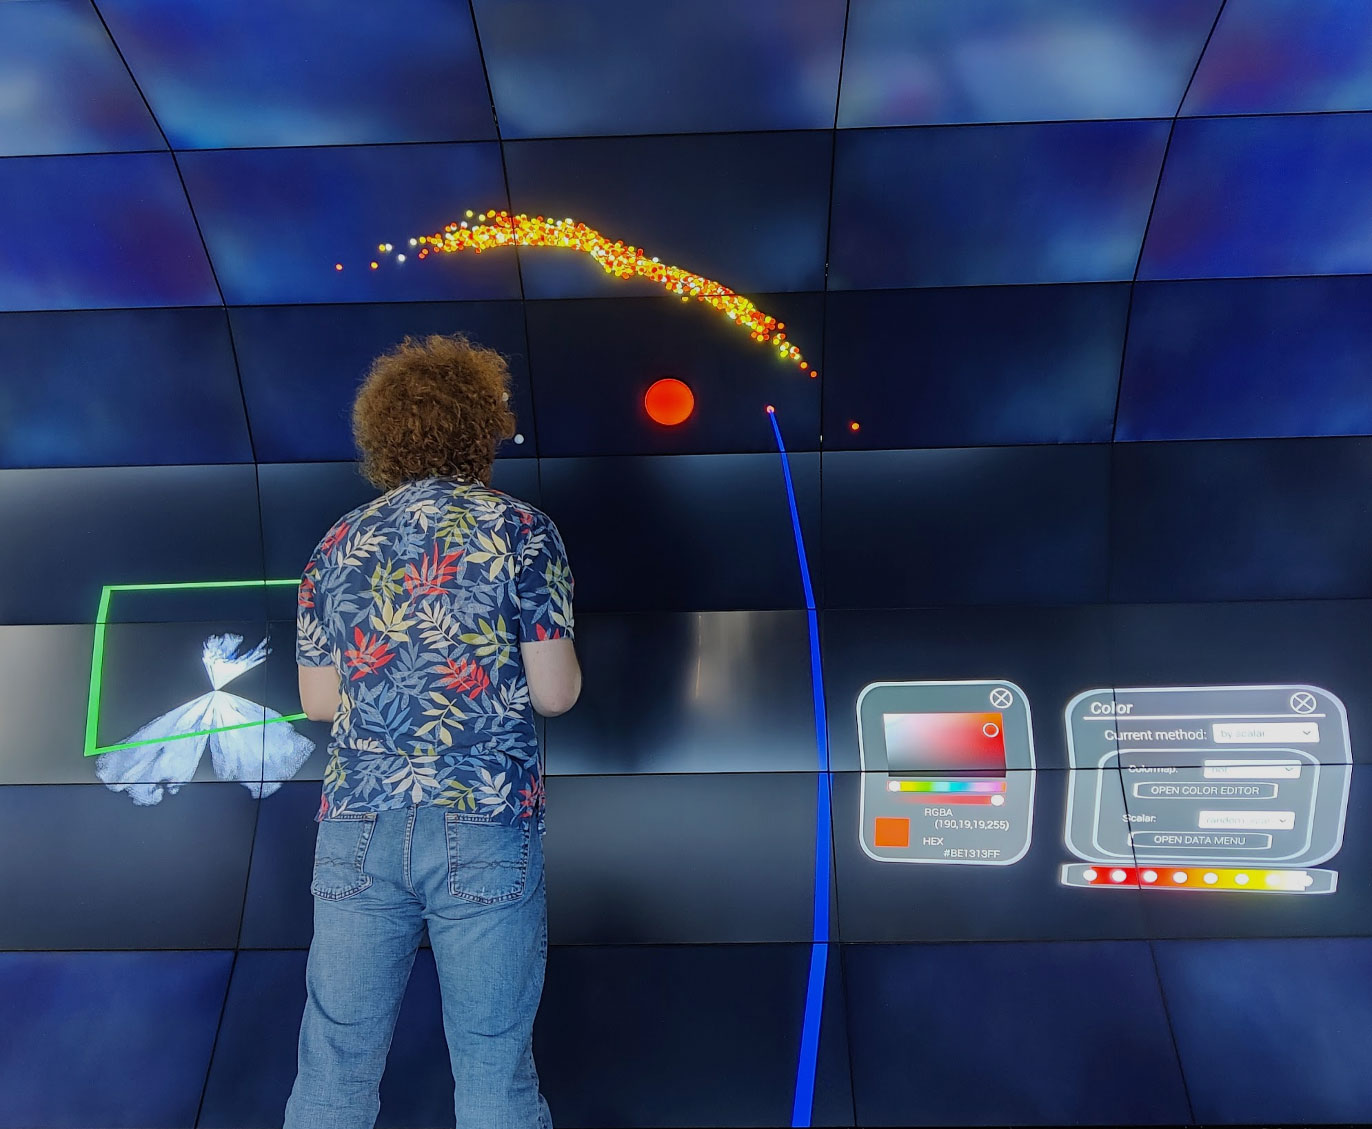
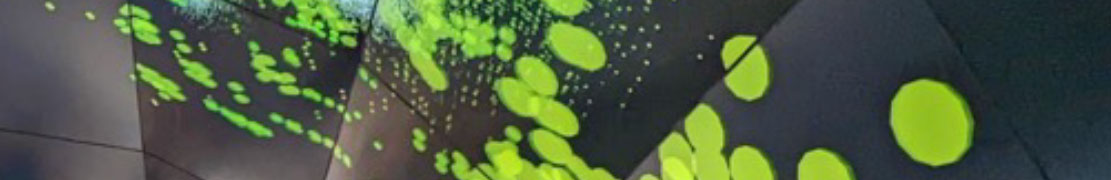
Caption: The VizLab system in action!
Ultimately, the work mostly centered around creating a data visualization platform in Unity/C# that leverages the VizLab’s unique capabilities to import, render, and interact with different astrophysics visualizations. Year one focused on building the foundations for the software, comprising three main pillars: visualization, data, and interactions. A wide variety of visualization types had to be implemented to cover the gamut of astrophysical data (including static and animated 3D scatterplots, volume-rendered density arrays, image datacubes, and more, as shown below), On the data side, data import for many common file types in the astrophysics community was needed, as well as a system for easily parsing said files such that their data can be visualized. Finally, interactions entailed building a rudimentary 3D UI for controlling visualization properties like color and scale and optimizing said UI for the VizLab’s unique control scheme.
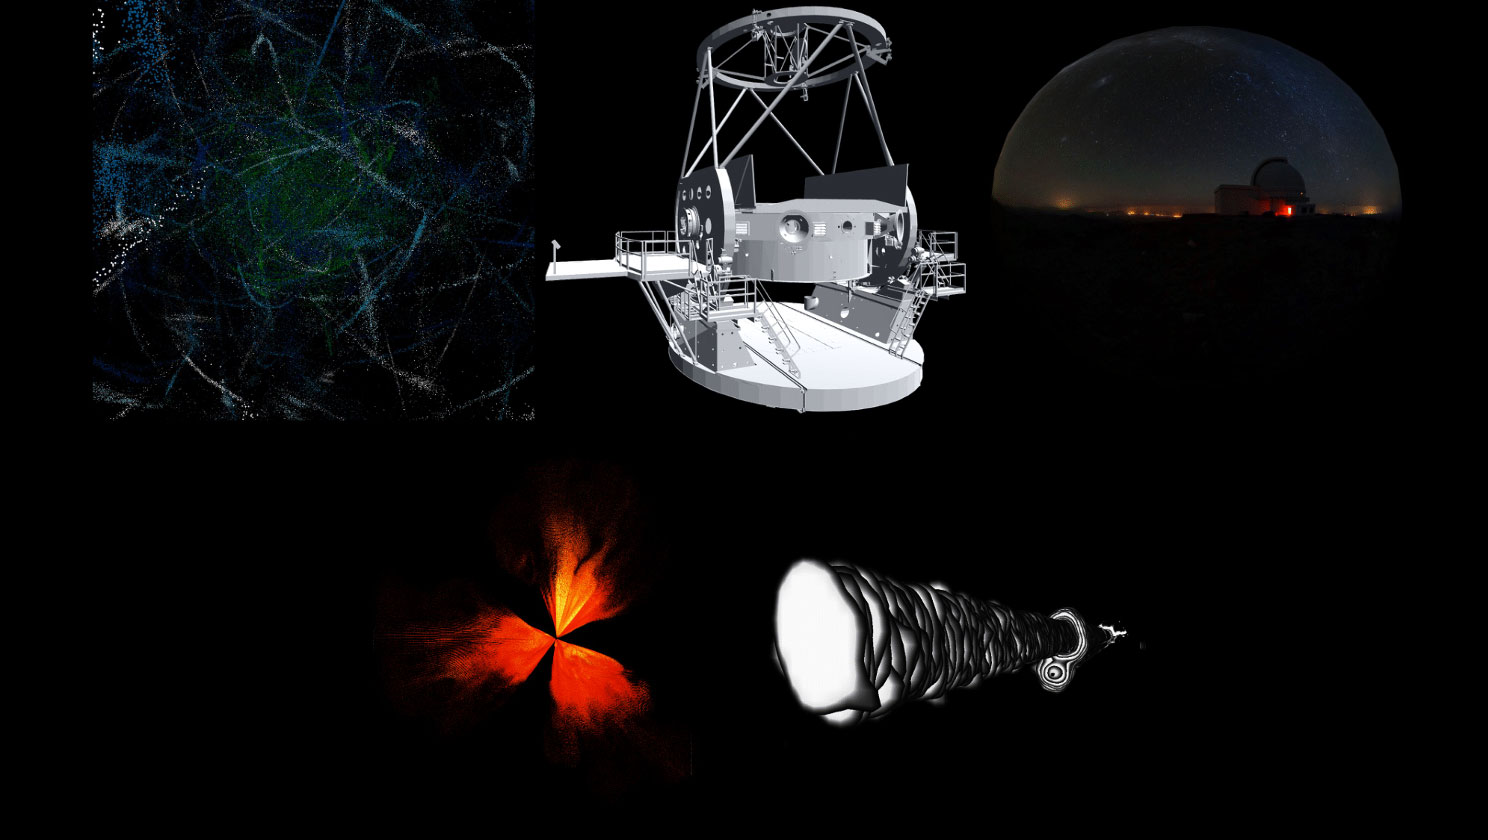
Caption: (top left) Point cloud visualization of simulated stellar streams (top center) CAD model visualization of the Magellan Telescope at Las Campanas Observatory (LCO) in Chile (top right) 360 degree image of the nightsky view, also at LCO (bottom left) volume-rendered 3D density visualization of a simulated supernova explosion (bottom right) 3D image stack visualization of galaxy data from the SDSS MaNGA survey.
Year two expanded the foundations from year one on many fronts. New data analysis features were developed, including a SQL-like data querying system and 2D graphing capabilities for further probing of loaded datasets. A key goal of reducing friction for researchers was accomplished through further improvements to data loading and UI along with careful documentation and tutorials. The software was also ported to additional platforms, including PC-backed and standalone VR systems. Finally, as many components of the software are first-of-its-kind implementations in Unity the Scholar is currently dividing and packaging the codebase to be released publicly under the Carnegie Github organization. These efforts also include a series of packages for future VizLab developers, enabling the system’s custom viewport and inputs to plug easily into standard development pipelines in Unity and Unreal. Aside from the main visualization work, several standalone software applications were also developed for outreach purposes, including a real-time n-body simulator that was a major hit at Carnegie’s Open House community event.
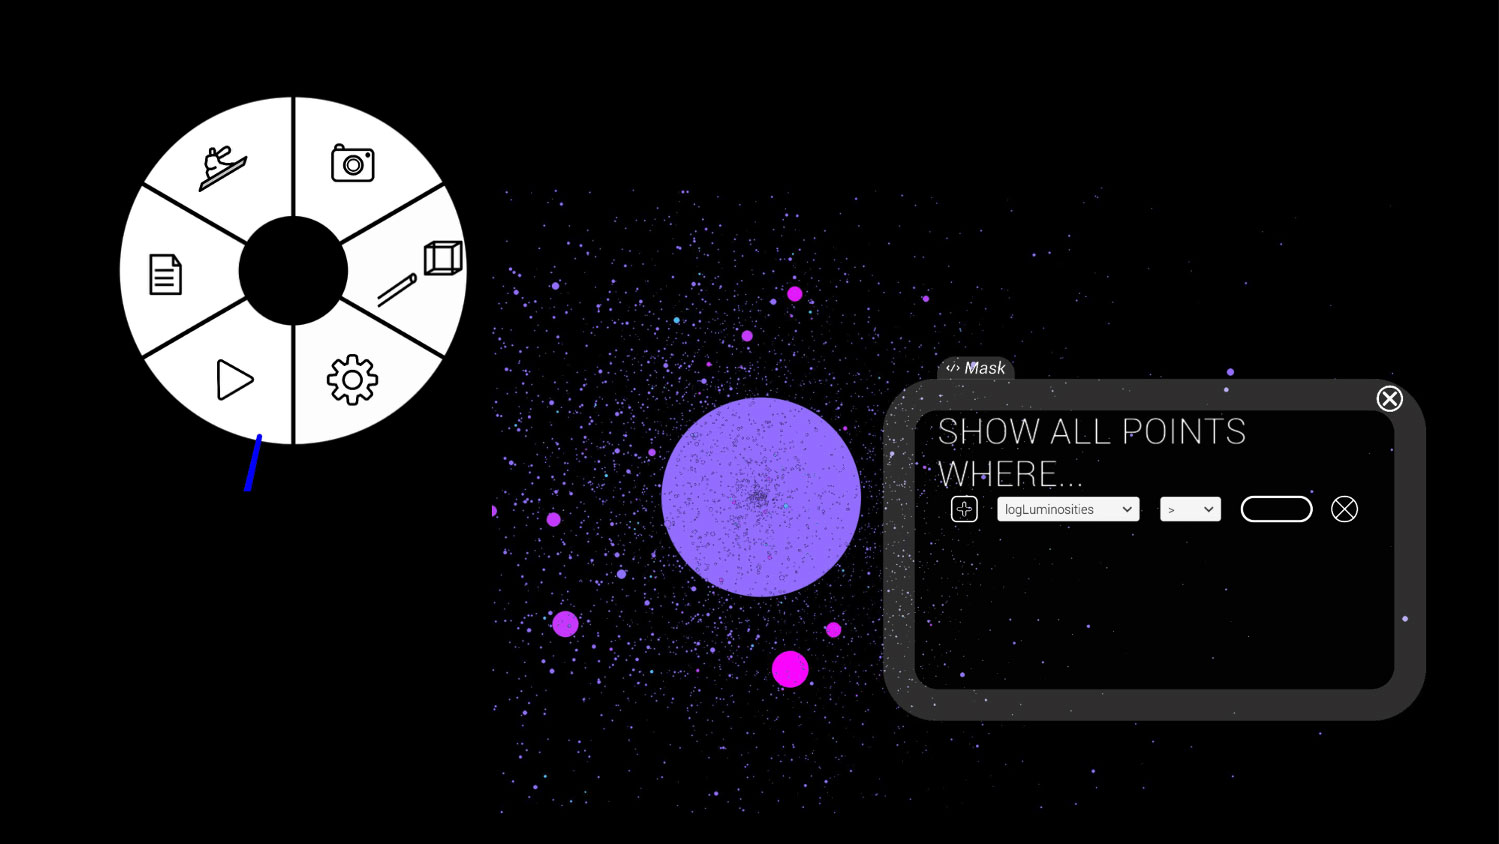
Caption: (left) Radial menus are employed to centralize UI options in a way that is natural to control with the system’s tracking features (right) A mask menu is used to do SQL-like filtering of the current galaxy formation dataset.
The future for the system is bright, with plans to make the VizLab a data visualization hub for the entire organization, expanding the feature set to accommodate data from more departments under the Carnegie Science umbrella.